Client
Digital Marketing Agency Client
Date
Jun 01, 2026
Services
Python, Node.js, Google BigQuery, Anthropic Claude (Sonnet 4.5)
Our Role
Data Engineer
PROBLEM STATEMENT
- Marketing and e-commerce teams spend hours every week manually pulling data from multiple platforms ,stitching them into spreadsheets, and building performance reports by hand.
- Decks were strategically inconsistent - tone varied by author, benchmarks were referenced unevenly, and client-specific context from calls and performance reviews rarely made it into the final report.
SOLUTION IMPLEMENTED
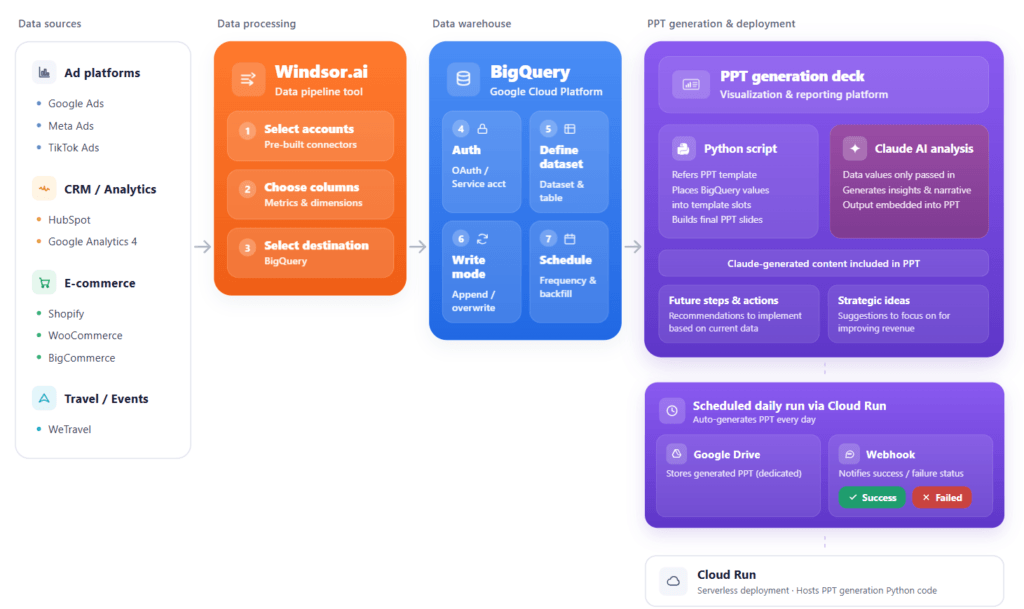
- Built a fully automated pipeline that produces, uploads, and notifies client decks daily with no human intervention.
- Strategic content generation by Anthropic Claude Sonnet 4.5. A rules-based system prompt with hard rules turns the data into deck copy.
- Charts are reconstructed at the XML level to support dual-axis combo visualisations, dynamically scaled axes, embedded creative thumbnails inside table cells and three-layer text-overflow protection
- Deploy and run unattended in the cloud, with notifications and quality gates.
- Each PPTX is uploaded to a per-client folder in the agency's Drive. A summary message is posted to the agency's Google Chat space showing per-client success or failure with the Drive link.
HIGHLIGHTS
- The entire process from data collection to final presentation is fully automated and runs daily without human involvement.
- The pipeline runs unattended on a daily schedule with no human in the loop. Failures degrade gracefully per client, so one client's data issue cannot block the other.
- Claude analyses the actual data values and not generic summaries.
- Produces slide-ready content covering revenue reasoning, strategic recommendations, and priority focus areas tailored to the numbers.
OUTCOMES
- Reduced the time from data to decision from days to hours, and introduced a structured feedback loop where Claude's recommendations directly inform the next week's strategy.
- Consistency as every client now receives the same template, the same number-formatting standards, the same tone guardrails, and the same structural sequence of strategic narrative.
- Creative-level performance from Meta Ads surfaces top-performing creatives per period, giving teams instant visibility on what's working.
KPI’S and Metrics Tracked
- Total Revenue & Revenue Change %
- Total Ad Spend (Facebook + Google)
- MER trend for rolling 13-week weekly series for the trend chart
- Analyzed Meta ads and Google ads data individuals such as Spend, Revenue, Impression, CTR, CPC
- Creative level performance - Spend, ROAS, CPA, CTR per creative
- Klaviyo metrics such as revenue, attribution share, flow performance
- AI-generated future steps and actions.